Trading in financial markets—whether it’s Forex, indices, stocks, or cryptocurrencies—can be both exciting and challenging. One of the most powerful tools at your disposal is the use of technical indicators. But how do you effectively use these indicators in TradingView, one of the most popular platforms for trading and market analysis? In this blog post, we’ll walk you through everything you need to know about using indicators in TradingView and how WallStreet Queen Official can elevate your trading game.
Why Indicators Matter in Trading
Indicators are essential tools that help traders identify buying and selling opportunities, visualize market trends, and forecast potential price movements. They are the backbone of technical analysis, allowing traders to make informed decisions based on historical price data and market behavior.
However, it’s important to remember that indicators alone don’t predict future price movements. They provide insights into key price levels and patterns, but their effectiveness depends on how well they are used. A solid trading strategy often combines multiple indicators with fundamental analysis to achieve consistent results.
Types of Indicators
There are several types of indicators, each serving a unique purpose:
- Trend Indicators: Help identify the direction of the market (e.g., Moving Averages).
- Momentum Indicators: Measure the speed of price movements (e.g., RSI, MACD).
- Volatility Indicators: Show how much the price fluctuates (e.g., Bollinger Bands).
- Volume Indicators: Track the number of trades executed (e.g., Volume Oscillator).
The key is to use a combination of these indicators to build a robust trading strategy. But how do you apply them in TradingView? Let’s dive in.
How to Use Indicators in TradingView
TradingView is a versatile platform that allows traders to analyze financial markets with ease. Whether you’re a beginner or a seasoned trader, here’s a step-by-step guide to using indicators in TradingView:
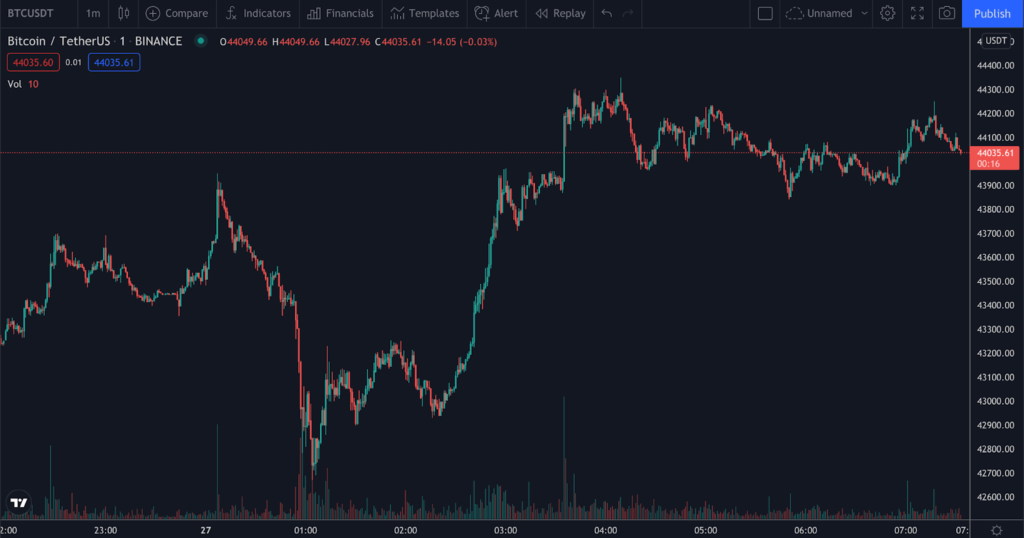
- Open a Chart: Start by selecting the trading pair you want to analyze, such as BTC/USD or EUR/USD. Choose a platform or exchange with high liquidity to ensure accurate price behavior.
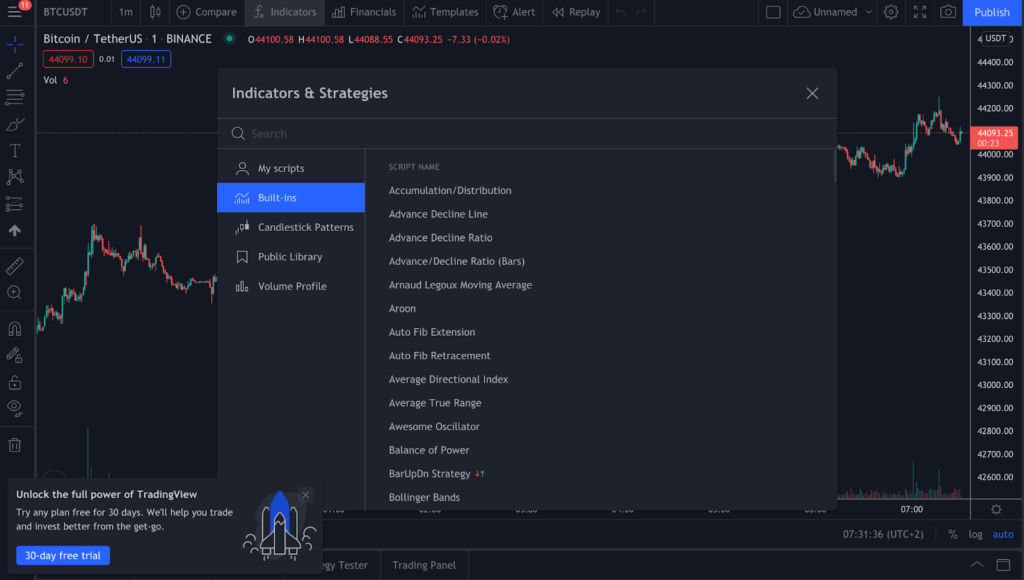
- Access the Indicators Menu: At the top of the screen, click on the “Indicators” button. This will open a window with a wide range of built-in and custom indicators.
- Add Your Indicator: Select the indicator you want to use. For example, if you’re analyzing volume, choose the Volume indicator. It will automatically appear at the bottom of your chart, providing insights into market activity.
- Customize and Analyze: Adjust the settings of your indicator to suit your trading strategy. Combine multiple indicators to get a comprehensive view of the market.
What’s the Best Indicator in TradingView?
The truth is, there’s no single “best” indicator. Successful trading requires a combination of tools and strategies. For instance, using volume alone won’t give you a complete picture, nor will relying solely on support and resistance levels. The key is to find a set of indicators that work well together and align with your trading style.
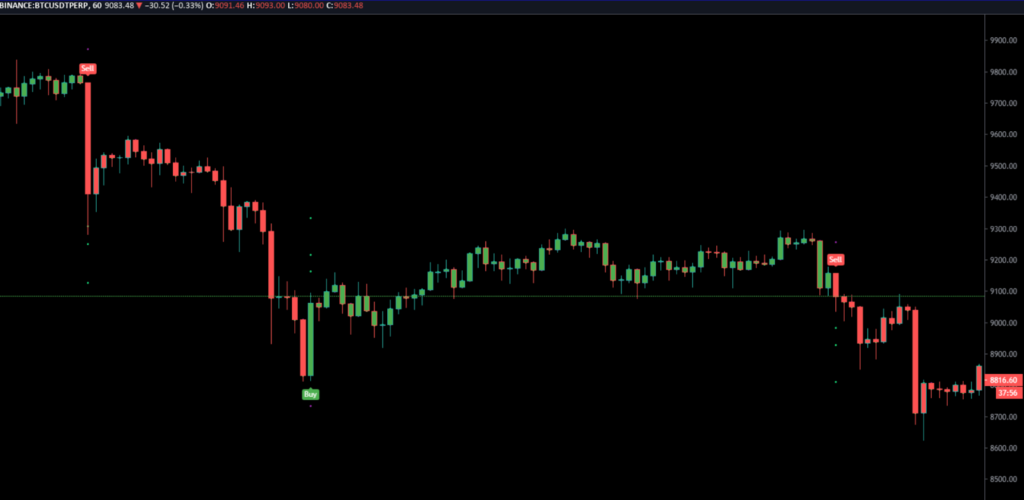
This is where WallStreet Queen Official comes in. Our proprietary tools and indicators are designed to help you identify high-probability trading opportunities with precision. By integrating WallStreet Queen’s advanced indicators into TradingView, you can gain a competitive edge in the market.
Why Choose WallStreet Queen Official?
WallStreet Queen Official is more than just a trading tool—it’s a game-changer for traders looking to maximize their profits. Here’s why:
- Advanced Analytics: Our indicators leverage cutting-edge technology to provide accurate and timely signals.
- User-Friendly Integration: Easily add WallStreet Queen indicators to your TradingView charts for seamless analysis.
- Proven Results: Join a community of traders who have successfully used WallStreet Queen to enhance their trading strategies.
Whether you’re trading cryptocurrencies, Forex, or stocks, WallStreet Queen Official empowers you to make smarter, data-driven decisions.
Final Thoughts
Using indicators in TradingView is a powerful way to analyze financial markets and identify trading opportunities. However, the real secret to success lies in combining the right tools with a disciplined strategy. With WallStreet Queen Official, you can take your trading to the next level by accessing advanced indicators and real-time insights.
Ready to transform your trading experience? Join the WallStreet Queen community today and start trading like a pro!
Disclaimer: The information provided in this blog post is for educational purposes only and should not be considered financial advice. Always consult with a professional financial advisor before making any investment decisions. Never invest more than you can afford to lose.
Leave a Reply